More comprehensive lab trend graphs with lab result graphing redesign Copied
The redesign of the lab result graphs will enable providers to generate, view, and print more comprehensive lab trend graphs, making it easier to review results over time and act before patients experience negative health changes.
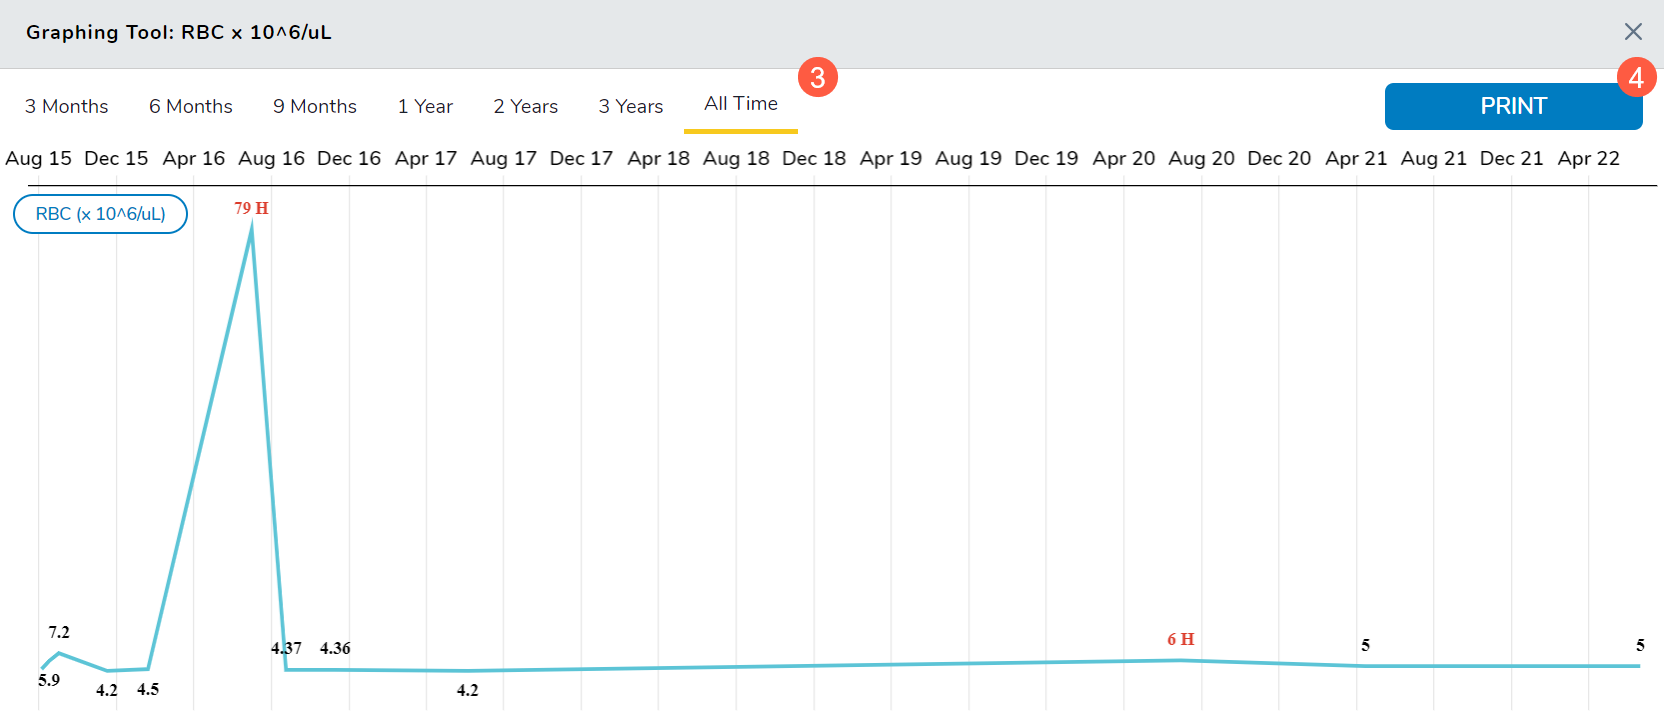
These new graphs allow you to review results in intervals of 3 Months, 6 Months, 9 Months, 1 Year, 2 Years, 3 Years, or All Time.
To use this feature:
- Open a patient chart and go to their Flowsheet.
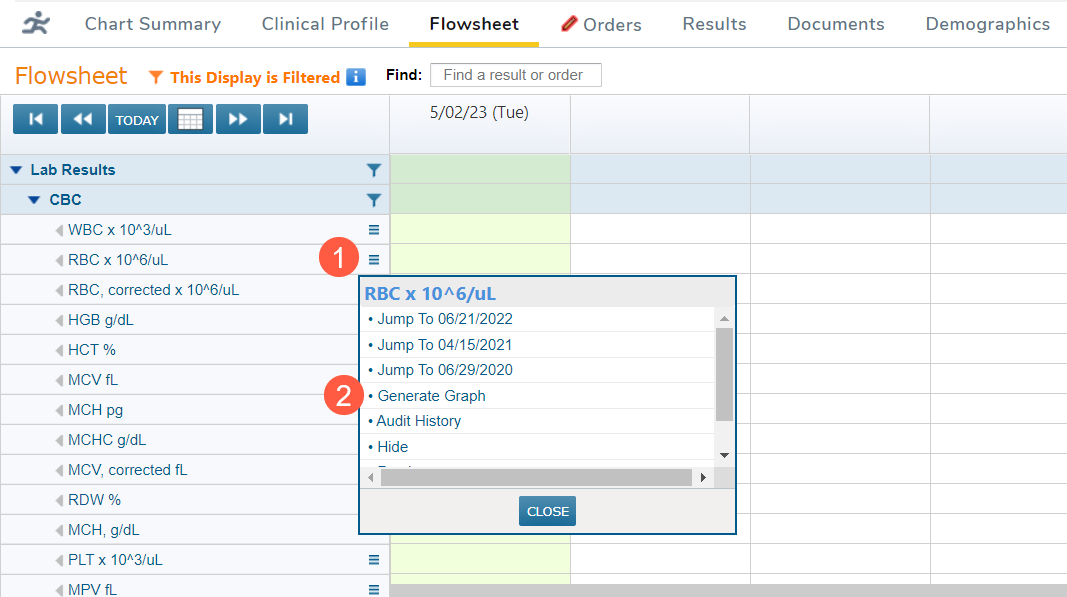
- Scroll through the Flowsheet and locate the resulted analyte you wish to see in a graph.
- Click the menu icon and select Generate Graph (callouts 1 and 2).
- Use the top-level options to select the time interval (callout 3).
- Select Print to print out the current view (callout 4).
NOTE: Only mapped labs can be graphed. Mapping panels and tests keep the Lab section in the Flowsheet organized. For more information on how to map labs, visit the Map a Lab page on the Help site.