Graph multiple analytes with lab result graphing redesign Copied
In the May 2023 release, we introduced more comprehensive lab trend graphs with a lab result graphing redesign. In this release, we added the ability to graph multiple analytes at once.
To use this feature:
- Open a patient chart and go to their Flowsheet.
- Scroll through the Flowsheet and locate the resulted analyte you wish to see in a graph.
- Click the menu icon and select Generate Graph.
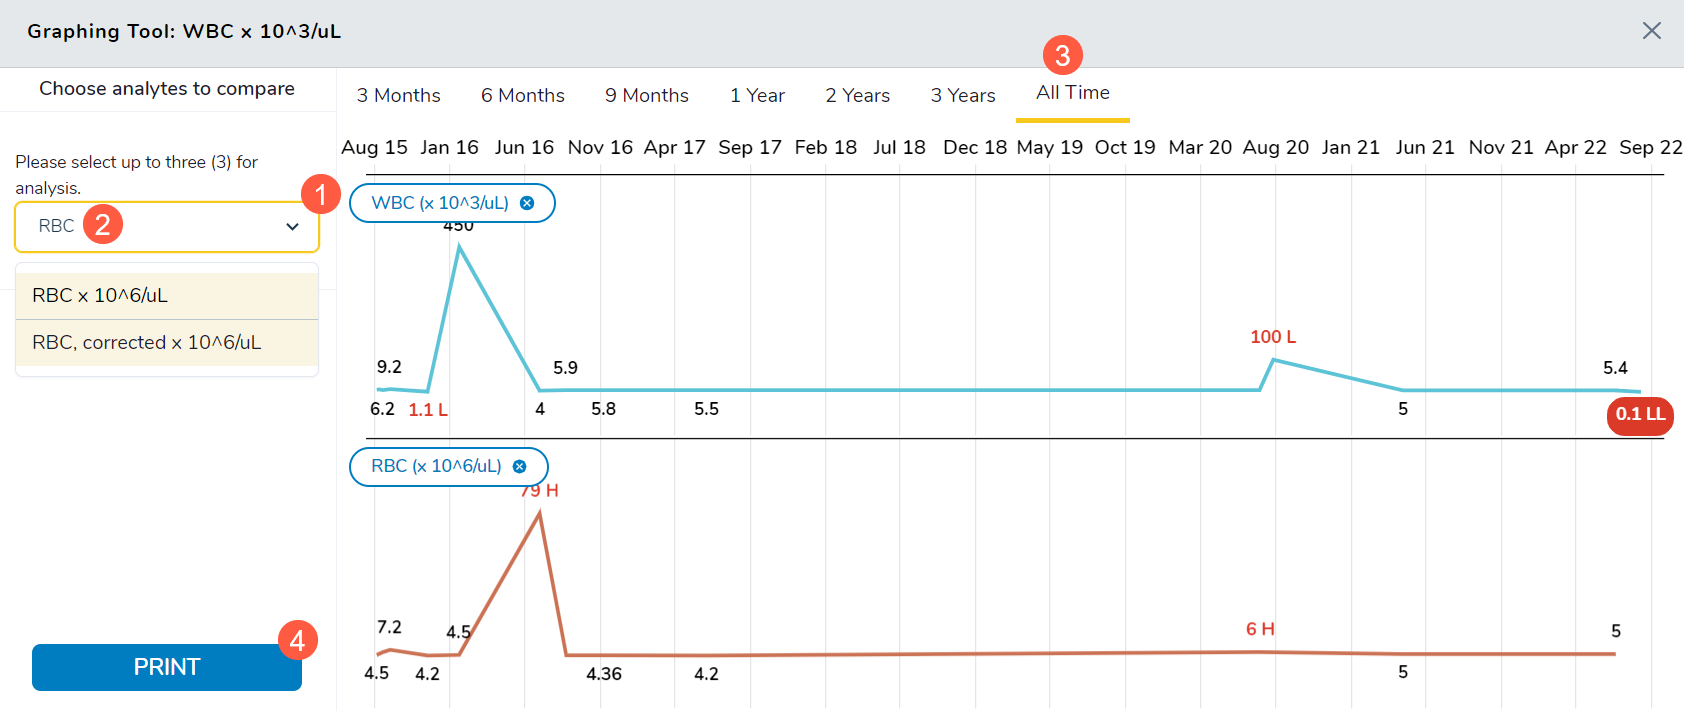
- Use the new Please select up to three (3) for analysis drop-down to choose additional analytes for comparison (callout 1).
- You may also type directly into the field to manually locate the desired analyte (callout 2).
- Use the period options across the top of the graph to compare the analytes over an interval of time (callout 3).
- Select Print to print out your current view (callout 4).
NOTE: Only mapped labs can be graphed. Mapping panels and tests keep the Lab section in the Flowsheet organized. For more information on how to map labs, visit the Map a Lab page on the Help site.